The Science Behind Climate Change
As part of participation in the making of “Halting Hades”, students master the physical science basis of climate change to conduct professional interviews with leading researchers. Understanding atmospheric physics, ocean chemistry, and climate attribution science is essential for informed democratic participation in addressing humanity’s greatest challenge.
Atmospheric Physics Mastery
Students explored fundamental greenhouse gas science, understanding how CO2 concentrations of 422.8 ppm in 2024—representing a 50% increase from pre-industrial levels—trap heat through radiative forcing. The 3.75 ppm annual increase in 2024 was the largest on record since measurements began in 1958.
Climate Attribution Science
The documentary examines how scientists determine human fingerprints on climate change. The IPCC confirms with high confidence that emissions from human activities are responsible for approximately 1.1°C of warming since 1850-1900, with unprecedented changes occurring in every region.
Critical Climate Science Findings
Based on the latest IPCC Sixth Assessment Report and real-time NOAA monitoring data, students engage with the most current scientific understanding of our changing climate system.
Temperature & Warming Trends
Current Status: Global surface temperatures have reached 1.1°C above 1850-1900 levels. The IPCC projects more than 50% chance of reaching 1.5°C by 2040, with potential for 2037 under high-emission scenarios. Every 0.5°C of additional warming causes clearly discernible increases in heat extremes, heavy rainfall, and regional droughts.
Atmospheric Carbon Dioxide
Current Status: CO2 levels reached 422.8 ppm in 2024, with the largest annual increase (3.75 ppm) since Mauna Loa measurements began. This represents a 50% increase from pre-industrial levels of 280 ppm. The ocean absorbs about 30% of CO2 emissions, helping regulate atmospheric concentrations but altering ocean chemistry.
Ocean Acidification
Current Status: Ocean pH has decreased by 0.1 units since the industrial revolution—a 30% increase in acidity due to CO2 absorption. All 11 U.S. large marine ecosystems show consistent acidification trends from 1998-2022, threatening shellfish, coral reefs, and marine food webs.
Extreme Weather Attribution
Current Status: Changes in Earth’s climate are now unparalleled over centuries to millennia, occurring in every region from rising sea levels to disappearing sea ice. Scientists can now attribute specific extreme weather events to climate change with increasing precision and confidence.
Student Engagement with Climate Data
Rather than simplifying complex science, “Halting Hades” demonstrates how students can engage directly with primary scientific sources and real-time climate monitoring data.
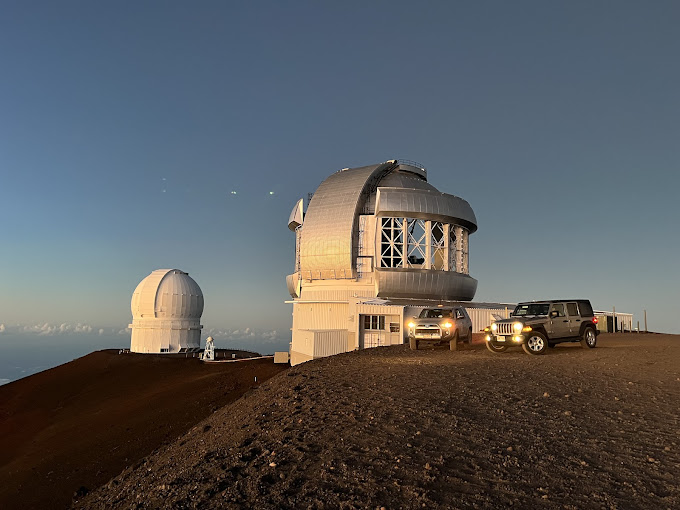
NOAA Mauna Loa Observatory
Atmospheric CO2 Monitoring • The Keeling Curve
Global atmospheric baseline
Daily CO2 concentration updates
Students learn to interpret the Keeling Curve, understanding seasonal fluctuations driven by Northern Hemisphere vegetation cycles and the relentless upward trend from fossil fuel emissions. The curve shows how CO2 concentrations have risen from 315 ppm in 1958 to over 427 ppm at seasonal peaks in 2024.
IPCC Sixth Assessment Report
Physical Science Basis • Working Group I
14,000+ scientific studies analyzed
Approved by 195 UN member governments
Students engage with the IPCC’s comprehensive assessment of climate science, learning how scientific consensus emerges from rigorous peer review. The report provides regional climate projections and quantifies climate sensitivity between 2.5°C and 4.0°C for each doubling of atmospheric CO2.
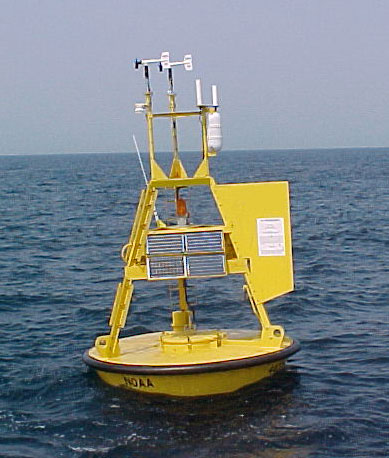
NOAA Ocean Acidification Program
Marine Chemistry • Ecosystem Impacts
pH, pCO2, and carbonate measurements
Real-time ecosystem status reporting
Students explore how ocean acidification monitoring reveals the marine consequences of CO2 emissions. Over 150 billion metric tons of CO2 have been absorbed by oceans since the industrial revolution, creating conditions not seen in 800,000 years and threatening calcifying organisms from shellfish to coral reefs.
Real-Time Climate Data Integration
Students access the same data sources used by climate scientists worldwide, learning to interpret and analyze current atmospheric and oceanic conditions.
Current Climate Monitoring Data
Atmospheric CO2
Temperature Anomaly
Ocean pH
CO2 Concentration Trend (1958-2024)
1970: 325.0 ppm |████████████████████ |
1980: 340.0 ppm |████████████████████████ |
1990: 355.0 ppm |██████████████████████████ |
2000: 370.0 ppm |████████████████████████████ |
2010: 390.0 ppm |██████████████████████████████ |
2020: 415.0 ppm |████████████████████████████████ |
2024: 422.8 ppm |████████████████████████████████████| ← RECORD HIGH
Scientific Literacy for Democracy
The film demonstrates why scientific literacy is essential for democratic decision-making about climate policy, energy systems, and economic transitions.
Understanding Uncertainty
Students learn that scientific uncertainty doesn’t negate the need for action. While climate sensitivity ranges from 2.5°C to 4.0°C per CO2 doubling, the direction of change is clear. As Dr. Adam Sobel testified to Congress, uncertainty is not a reason to delay climate action.
Evaluating Evidence
The project teaches students to distinguish between natural climate variability and human-caused trends. With global emissions reaching record highs in 2023 instead of declining toward 1.5°C pathways, students understand the urgency of immediate action.
Carbon Budget Science
For 1.5°C pathways, only 510 GtCO2 can be emitted before reaching net-zero in the early 2050s. Yet existing fossil fuel infrastructure could emit 850 GtCO2, exceeding this budget by 340 GtCO2.
Tipping Points & Thresholds
At 2°C warming, concurrent crop failures across major growing regions become likely. Above 3°C, dangerous summer heat threatens communities across southern Europe. Understanding these thresholds informs policy urgency.
Regional Climate Impacts
The IPCC’s new Interactive Atlas allows students to explore climate change at regional scales, connecting global warming to local consequences like sea-level rise in coastal cities and changing precipitation patterns.
Solutions & Pathways
Science shows that limiting warming to 1.5°C or 2°C requires immediate, massive emissions reductions across all sectors this decade, with global net-zero CO2 by the early 2050s for 1.5°C pathways.
Science-Based Climate Education
See how students master complex climate science to conduct professional interviews and engage in informed democratic participation about our planet’s future.
Scientific Resources
Access the same data sources students used: NOAA’s Global Monitoring Laboratory for CO2 data, IPCC Assessment Reports for climate projections, and NOAA’s Ocean Acidification Program for marine chemistry monitoring.